

Many Odoo reporting requests start the same way: the business wants better visibility, clearer KPIs, and one place where management can understand what is happening operationally.
The first assumption is often that this requires a custom Odoo view, a bespoke dashboard module, or an external BI platform such as Power BI.
Sometimes it does, but not always.
Not every reporting request needs a custom Odoo view. In many cases, Odoo Spreadsheets can provide a practical reporting layer that is flexible enough for business users, structured enough for management dashboards, and maintainable enough to avoid unnecessary development.
Odoo Spreadsheets are one of the most underused reporting features in Odoo Enterprise. They sit between standard Odoo views and fully custom BI development, giving businesses a way to build dashboards using familiar spreadsheet concepts while staying connected to live Odoo data.
Why Businesses Ask for Dashboards in Odoo
Most dashboard requests are not really about dashboards. They are about visibility.
Managers want to understand:
- Which work is delayed
- Where operational bottlenecks are appearing
- How teams are performing
- Which invoices, deliveries, or processes need attention
- Whether the business is moving in the right direction
Odoo already contains a lot of this data. The issue is that the information is often spread across multiple apps, menus, pivot views, list views, and reports.
A user may need to open Sales for revenue, Inventory for deliveries, Accounting for invoices, Project for tasks, and another app for operational progress. Each view may be useful on its own, but decision-makers usually want the relevant information centralised.
That is where dashboards become valuable.
The Limitation of Standard Odoo Views
Odoo’s standard reporting views are powerful, but they are not always ideal for management reporting.
A pivot view can answer one question very well. A graph view can show one trend clearly. A list view can expose operational records in detail.
But business reporting often requires several questions to be answered together:
- Sales by month
- Margin by product category
- Open deliveries by status
- Invoice totals by customer group
- Turnaround time by operational stage
- Team workload by user
- Exceptions requiring management attention
When each question lives in a separate view, reporting becomes fragmented. This is one reason businesses export data into Excel or ask for BI dashboards.
They are not always asking for complex analytics. Often, they simply want related information in one place.
Where Odoo Spreadsheets Fit
Odoo Spreadsheets provide a practical way to bring ERP data into a spreadsheet-style reporting environment.
For many business users, that matters. If someone understands Excel, they already understand much of the mental model: formulas, tables, lookups, summaries, filters, charts, and calculated reporting areas.
The difference is that the spreadsheet can be connected to Odoo data rather than relying on manual exports.
This makes Odoo Spreadsheets especially useful when the goal is not to build a complex reporting engine, but to make operational information easier to consume.
A simple dashboard can already combine several reporting formats in one place: headline KPIs, trend charts, ranked tables, maps, and filtered breakdowns. This is the main advantage over jumping between separate Odoo pivot views.
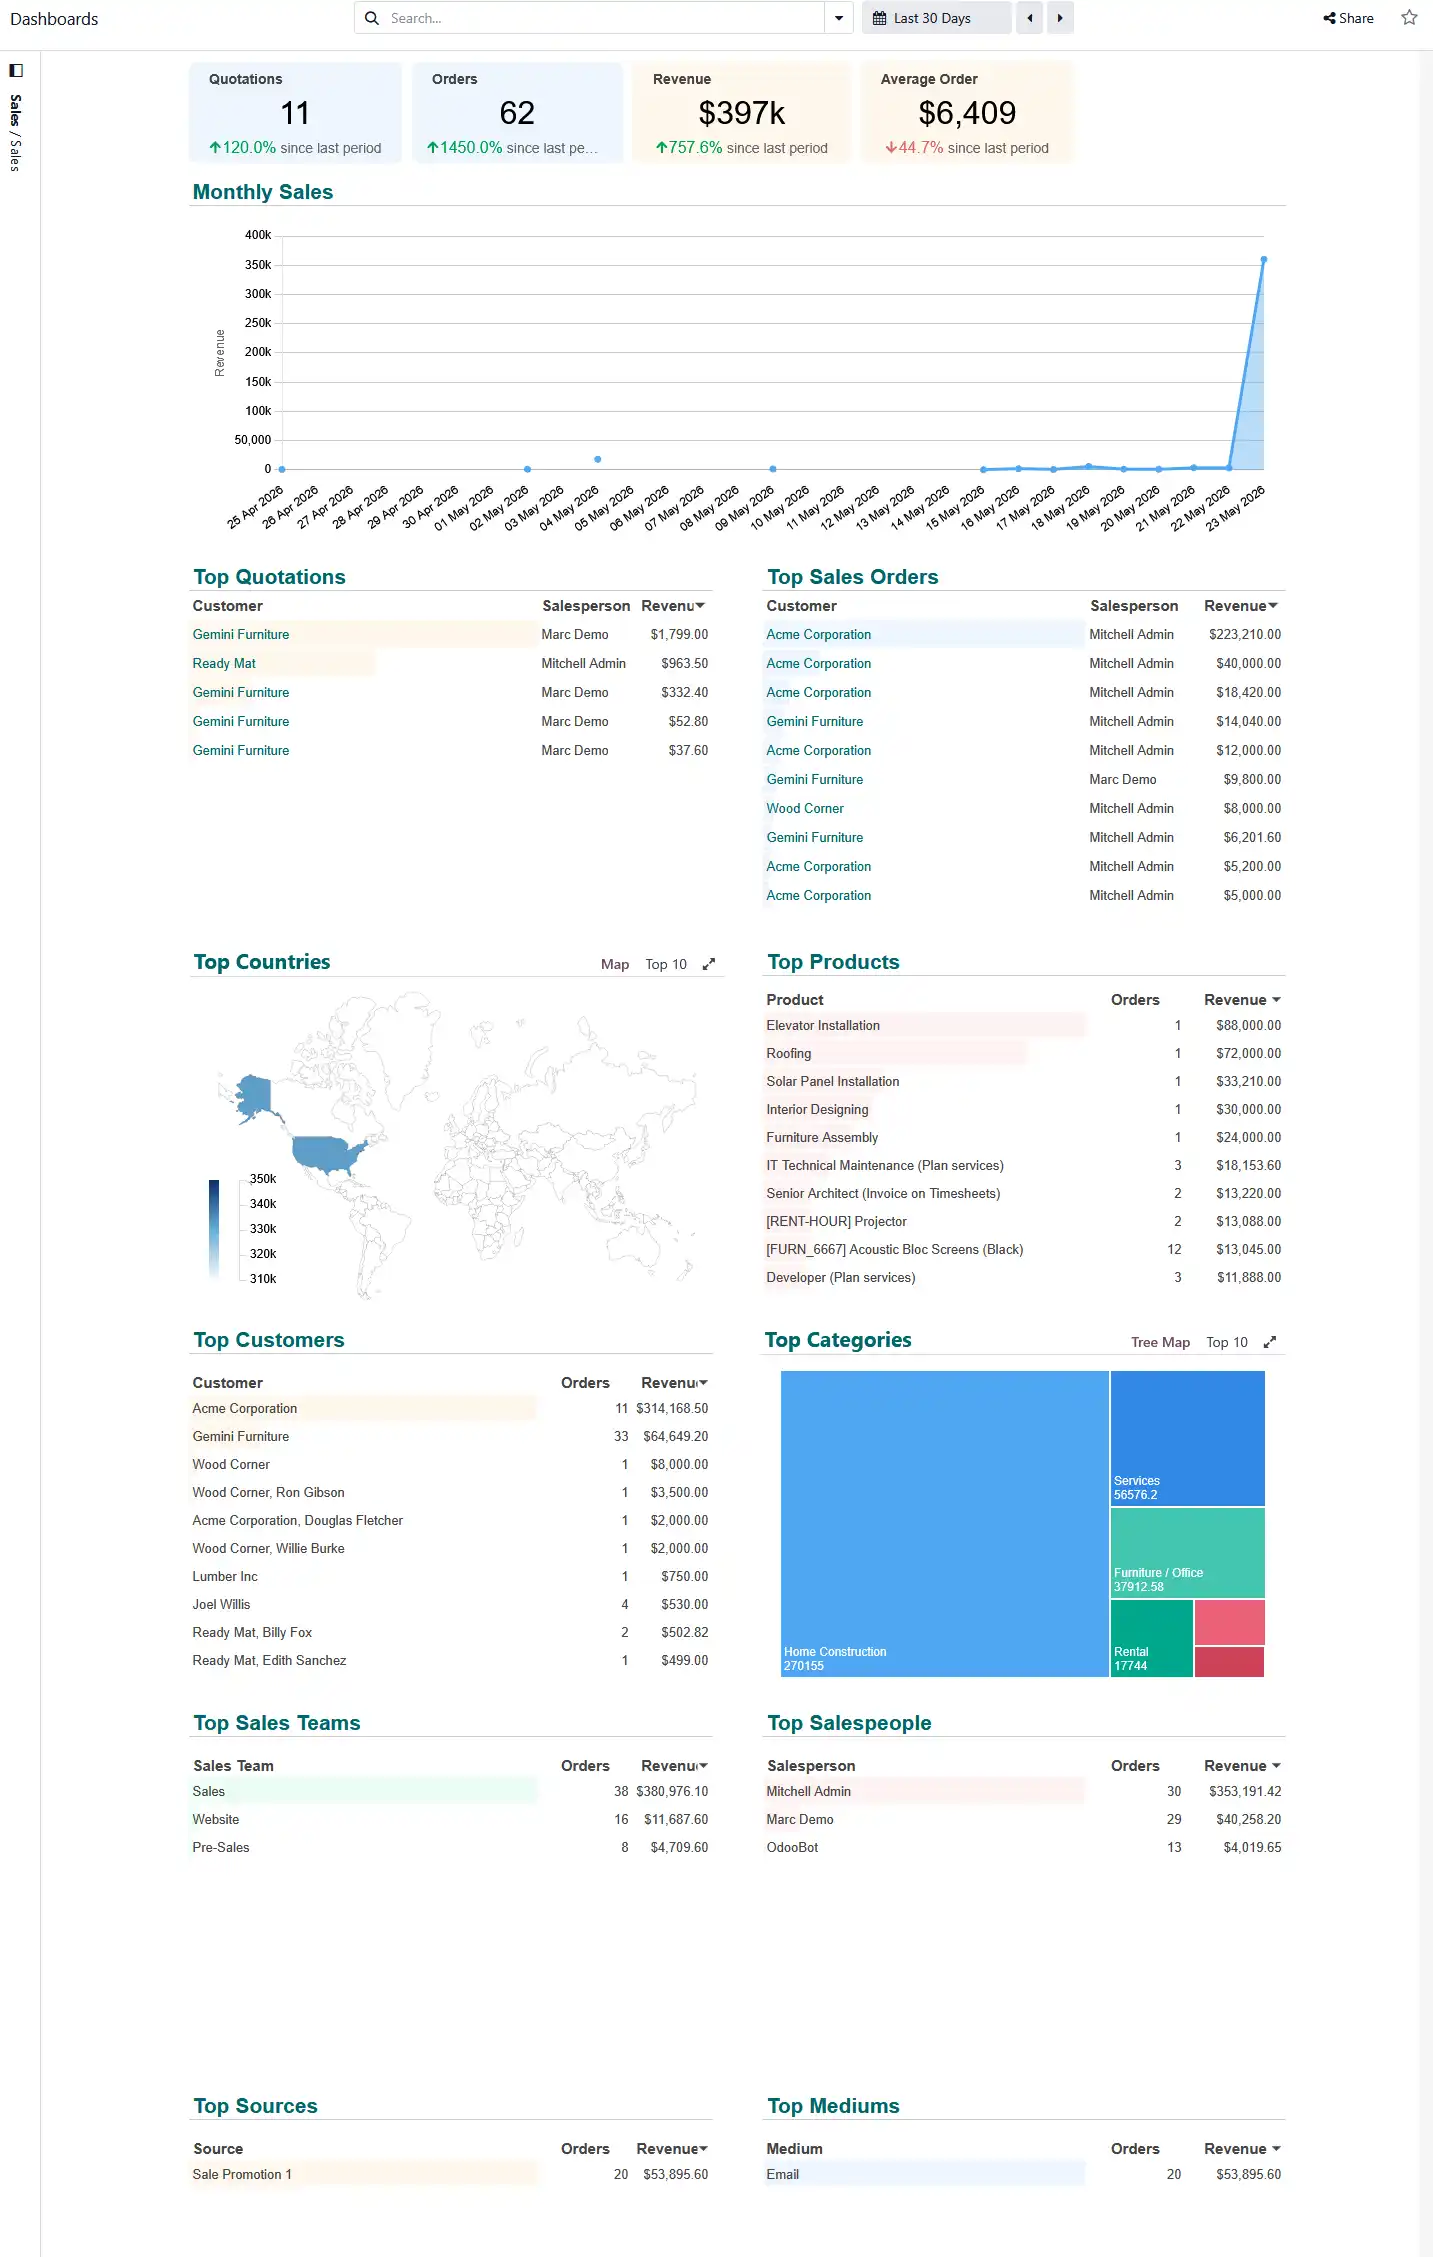
The value is not that every dashboard needs to look complex. The value is that related questions can be answered together, without requiring users to export several reports or navigate across multiple Odoo apps.
Why Odoo Spreadsheets Can Avoid Unnecessary Development
Custom development has a cost beyond the initial build.
Every custom dashboard or reporting view needs to be designed, developed, tested, maintained, documented, and reviewed during future upgrades.
That does not mean custom reporting is wrong, sometimes it is absolutely the correct choice.
But if the requirement is mainly to centralise KPIs, combine existing Odoo data, and give management clearer visibility, Odoo Spreadsheets can often bypass the development cycle completely.
This is the beauty of the feature. If the spreadsheet dashboard works, there may be no need to rebuild it as custom code.
Instead of starting with development, the business can:
- Pull relevant Odoo data into a spreadsheet
- Build initial KPIs using familiar spreadsheet formulas
- Add charts, tables, filters, and breakdowns
- Review the dashboard with users
- Adjust the layout and formulas quickly
- Save the result as a dashboard where appropriate
This is often a better implementation path because it keeps reporting flexible while the business works out what is genuinely useful.
Practical Dashboard Use Cases
Odoo Spreadsheets are especially useful where the business needs several related metrics in one place.
Management Dashboards
A management dashboard might combine sales performance, invoices, outstanding deliveries, overdue tasks, and operational exceptions.
None of those figures are necessarily difficult to access individually. The value comes from consolidating them into one place.
Team Dashboards
A team dashboard may focus on workload, pending actions, delays, and responsibilities.
This can be useful when managers need a practical overview of team activity without manually switching between multiple Odoo apps.
Delivery Dashboards
Delivery and operational dashboards can help businesses monitor fulfilment stages, delays, and handover points.
For example, a business may want to track the time between an order being confirmed, picked, packed, and dispatched from the warehouse.
This kind of dashboard can highlight where delays are happening: whether orders are waiting too long before picking starts, spending too much time in packing, or being held before dispatch.
This is not necessarily advanced BI. It is operational visibility.
Invoice and Finance Visibility
Finance reporting often requires pulling data from several dimensions at once.
If the required information already exists in Odoo, spreadsheets can often provide a faster first step than building a completely custom reporting module or moving immediately to an external BI platform.
The Hardest Part Is Choosing the Right Data Source
Odoo Spreadsheets feel familiar once the data is available. The harder part is often deciding where the data should come from.
Odoo contains many ways to look at the same business process.
For example, sales performance might be analysed from:
- Sales orders
- Sales order lines
- Invoices
- Invoice lines
- Products
- Customers
- Sales teams
- Accounting entries
Each source answers a slightly different question.
This is where implementation understanding matters. A dashboard is only useful if the source data reflects the decision being made.
Sales orders show commercial activity. Invoices show financial recognition. Deliveries show fulfilment. Accounting entries show posted financial reality.
Those are related, but they are not interchangeable.
This is why dashboard work should start with the business question, not the chart.
This is where practical Odoo experience matters. The value is not just in building the dashboard, but in choosing the right model, pivot, or reporting source so the numbers answer the business question accurately.
Performance Considerations
Odoo Spreadsheets are useful, but they still need to be designed carefully.
All dashboard data still has to come from the Odoo system. Odoo has put significant effort into optimising pivot queries, which makes pivot-based spreadsheet data sources a good starting point for many dashboards.
Large raw lists should generally be avoided where possible. Pulling thousands of detailed records into a spreadsheet can make the dashboard harder to use and heavier to load.
Pivots are usually better for dashboard reporting because they summarise data before it reaches the spreadsheet.
There is also an important distinction between data retrieval and spreadsheet calculation.
Odoo retrieves the source data from the server, but spreadsheet formulas run locally on the user’s device. This has two practical consequences.
- Heavy formulas do not usually block Odoo for other users
- Very complex dashboards may feel slower on older devices
For most normal dashboards, this is not a problem. But it is worth keeping in mind when adding many formulas, large datasets, or layered calculations.
A good dashboard should usually summarise first and expose detail only where needed.
What Odoo Spreadsheets Are Not
Odoo Spreadsheets are not a complete replacement for every BI platform.
They are not always the right tool for:
- Complex external data blending
- Advanced statistical modelling
- Very large analytical datasets
- Real-time operational screens
- Deeply customised reporting workflows
They are also primarily an Odoo Enterprise feature. While dashboard display may technically be possible in some Community contexts, the lack of a proper spreadsheet editor makes this much less practical.
If a business is using Odoo Community and wants extensive dashboarding, custom development or an external reporting tool may still be required.
When Custom Development Still Makes Sense
Custom development is still the right choice when the requirement is operational rather than analytical.
If users need a real-time working screen that drives day-to-day activity, a spreadsheet dashboard may not be enough.
Similarly, if the dashboard depends on new business objects, complex workflow logic, or external systems not already represented inside Odoo, development may still be required.
There are also cases where spreadsheets can support complex pricing logic.
Odoo includes quote calculator functionality that can be useful for pricing structures that do not fit neatly into standard pricelists or product variants. For some businesses, this may be enough.
But when pricing logic needs to generate manufacturing data, create bills of materials, or build operational records dynamically, custom development may still be required.
The key is choosing the tool based on the business requirement, not defaulting immediately to either no-code reporting or custom code.
Good Dashboards Should Simplify Decisions
One mistake businesses make with dashboards is trying to recreate every report, every spreadsheet, and every metric in one place.
That usually creates visual noise rather than clarity.
A good dashboard should answer practical questions:
- What needs attention?
- Where are delays happening?
- Which numbers changed?
- Who needs to act?
- Which process is under pressure?
The goal is not to display every possible data point. The goal is to help people make better decisions faster.
This is where Odoo Spreadsheets can be particularly useful. They allow teams to start simple, add metrics gradually, and refine dashboards based on actual use instead of assumptions.
Conclusion
Odoo Spreadsheets are an underused reporting layer for businesses that want better dashboards without immediately committing to custom development or external BI tools.
They are especially useful when the business needs centralised KPI visibility, spreadsheet-style flexibility, and reporting based on live Odoo data.
They are not the answer to every reporting requirement. Complex analytics, real-time operational screens, and advanced external data modelling may still require custom development or dedicated BI platforms.
But for many dashboard requests, Odoo Spreadsheets are a practical first step.
They help businesses explore what they actually need, reduce unnecessary development, and turn existing Odoo data into clearer operational visibility.
Related Odoo Reporting Topics
Odoo Spreadsheets are part of a wider reporting and ERP visibility strategy, especially for businesses trying to avoid unnecessary custom development.